

Build a PostgreSQL Data Visualization Dashboard
Explore PostgreSQL data and turn read-only queries into charts, metrics, and live analytics dashboards.
Author:Moldable
Category:Developer Tools
Data visualizationCharts & analyticsLive dashboards

1
Connect your data safely
Connect each PostgreSQL environment with read-only access. Credentials stay behind Moldable's secure credential broker.
Set up Database as an analytics workspace:
- Add clear Local, Staging, and Production environment labels
- Keep Production read-only
- Pin the orders, customers, and failed_jobs tables
- Show the metrics I check most often
2
Save questions you ask often
Save repeatable, read-only analysis queries and export bounded results when you need to share the underlying data.
Track revenue
Create a saved read-only query for weekly orders and revenue, split by plan
Compare cohorts
Compare retention for customers who joined in each of the last six months
3
Turn results into a dashboard
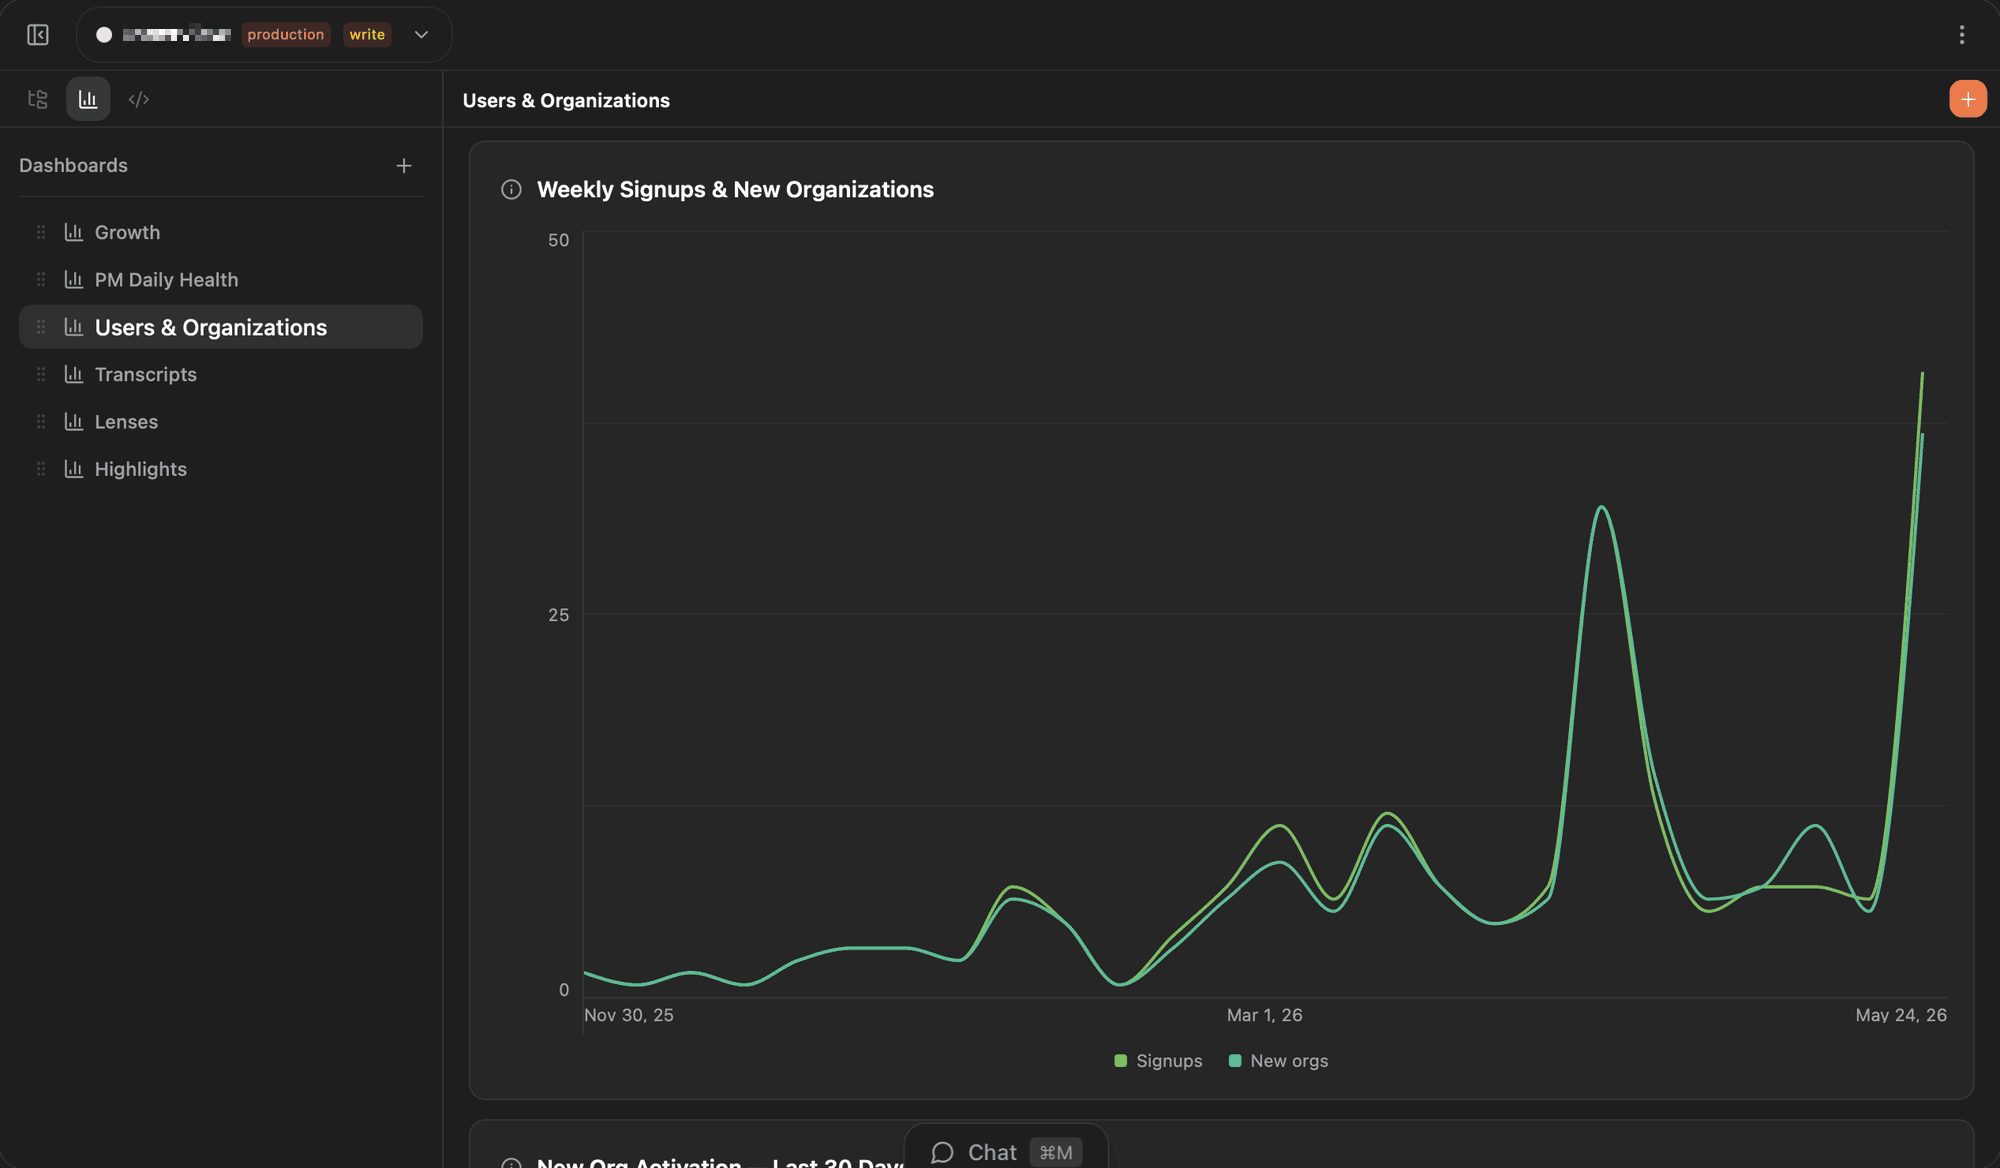
Turn saved queries into numbers, tables, and charts. Keep live analytics beside the data they explain.
Create an operations dashboard with today's orders, failure rate, and a seven-day volume chart
Ready to build your own?
Download Moldable and start creating apps that work exactly the way you want.
Download Moldable